About the Stock
Since its establishment in 2008, Kamdhenu Paints has established itself as the painting division of Kamdhenu Limited, a key player in the building and construction sector. Specializing in a wide array of decorative paint solutions such as Exterior and Interior Emulsions, Cement Paints, Water-based Primers, and more, Kamdhenu Paints caters effectively to a diverse range of preferences and requirements.
In a proactive move towards sustainability, Kamdhenu Paints has obtained GRIHA certification for their paint selections like Kamo Dual, Richlook, and others. This certification underscores their dedication to promoting a greener future. By seamlessly integrating cutting-edge technology, customer-focused strategies, and a strong environmental ethos, Kamdhenu Paints exemplifies the spirit of ‘Desh Ka Naya Rang’ (The New Color of the Nation).
Business Model
- Kamdhenu Paints’ success is built on offering cost-effective yet high-quality products.
- Renowned nationwide, Kamdhenu Paints is celebrated for its superior quality paints, catering to commercial and residential sectors alike.
- Customer acclaim has driven the expansion of their paint range, catering to diverse needs.
- Alongside affordability, Kamdhenu Paints’ products benefit from a strong distribution network, ensuring widespread availability across the nation.
| Company Valuation | |
| Sector | Consumer Durables |
| NSE | KAMOPAINTS |
| BSE | 543747 |
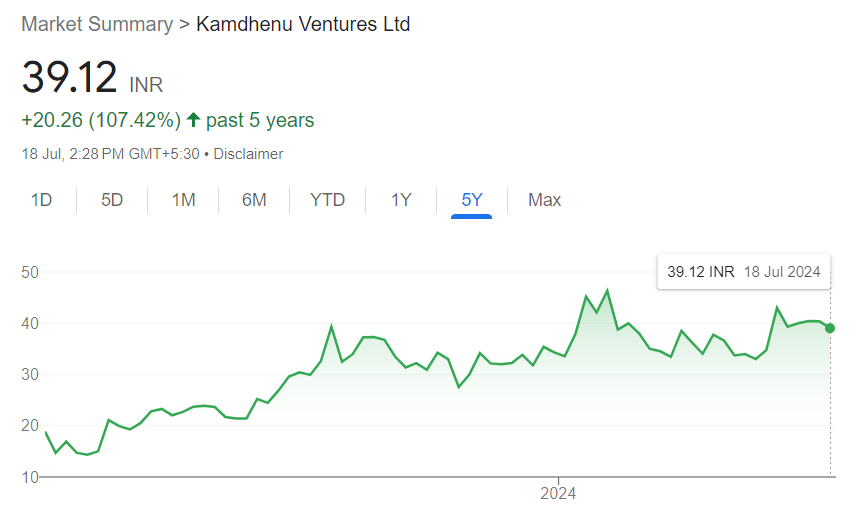
| Market Capitalization | Rs 1,229 Crore (As of July 18, 2024) |
| Book Value Per Share | Rs 5.07 |
| Face Value | Rs 1 |
| 52 week H/L | 49.00 / 27.00 |
| Dividend Yield (%) | — |
| Shareholding Pattern | |||
| Particulars | Sept-23 | Dec-23 | Mar-24 |
| Foreign Promoters % | 0 | 0 | 0 |
| Indian Promoters % | 50.33 | 50.33 | 50.33 |
| DIIs % | 0 | 0 | -0.01 |
| FIIs % | 15.19 | 16.83 | 10.53 |
| Others % | 34.48 | 32.84 | 39.15 |

| Ratios (Consolidated) | ||||
| Particulars | Mar 2021 | Mar 2022 | Mar 2023 | Mar 2024 |
| ROCE % | – | – | – | 11.99 |
| ROE % | – | – | – | 11.55 |
| ROA % | – | – | – | 5.65 |
| Interest Coverage Ratio | – | – | – | 6.35 |
| D/E | 9.52 | – | 0.69 | 0.12 |
| P/B | – | – | 6.86 | 6.57 |
| Balance Sheet (Consolidated Figures in Rs. Crores.) | ||||
| (Year-end March) | Mar 2021 | Mar 2022 | Mar 2023 | Mar 2024 |
| Share Capital | 0 | 0 | 13 | 31 |
| Reserves | 0 | 0 | 67 | 128 |
| Borrowings | 0 | 0 | 56 | 20 |
| Other Liabilities | 0 | 0 | 83 | 91 |
| Total Liabilities | 0 | 0 | 219 | 271 |
| Fixed Assets | 0 | 0 | 45 | 44 |
| Capital WIP | 0 | 0 | 1 | 0 |
| Investments (Long Term) | 0 | 0 | 0 | 0 |
| Other Assets | 0 | 0 | 174 | 226 |
| Total Assets | 0 | 0 | 219 | 271 |
| Profit & Loss (Consolidated Figures in Rs. Crores.) | |||||
| (Year-end March) | Mar 2020 | Mar 2021 | Mar 2022 | Mar 2023 | Mar 2024 |
| Sales | 0 | 0 | 0 | 260 | 292 |
| Other Income | 0 | 0 | 0 | 0 | 1 |
| Expenses | 0 | 0 | 0 | 260 | 269 |
| Operating Profit | 0 | 0 | 0 | 0 | 24 |
| OPM% | – | – | – | 0 | 8 |
| Interest | 0 | 0 | 0 | 6 | 3 |
| Depreciation | 0 | 0 | 0 | 5 | 5 |
| Profit Before Tax | 0 | 0 | 0 | -11 | 16 |
| Tax% | 7 | 0 | 0 | -2 | 13 |
| Net Profit | 0 | 0 | 0 | -11 | 14 |
| PATM% | 0 | 0 | 0 | -4 | 5 |
| Cash Flows (Consolidated Figures in Rs. Crores.) | ||||
| (Year-end March) | Mar 2021 | Mar 2022 | Mar 2023 | Mar 2024 |
| Cash from Operating Activity | 0 | 0 | 0 | -16 |
| Cash from Investing Activity | 0 | 0 | -3 | -6 |
| Cash from Financing Activity | 0 | 0 | -4 | 26 |
| Net Cash Flow | 0 | 0 | -8 | 5 |
Q4FY24 Result Update:
- FY24 marks a significant turnaround for Kamdhenu Ventures, with revenues increasing by 12% YoY to Rs. 292 crore.
- EBITDA and PAT have turned notably positive compared to the previous year.
- Achieved EBITDA Margins of 7.7% for FY24, driven by strong economies of scale and operational leverage.
- Average Selling Price per KG/Ltr. in FY24 rose to Rs. 90, a 14% increase from FY23, reflecting product premiumization.
- Q4 FY2024 highlights include Revenue from Operations at Rs. 85.1 crore, EBITDA at Rs. 7.3 crore, EBITDA Margins at 8.5%, and Profit After Tax of Rs. 4.2 crore.
| Quarterly Results (Consolidated Figures in Rs. Crores) | |||||
| Particulars | Mar 2023 | Jun 2023 | Sep 2023 | Dec 2023 | Mar 2024 |
| Sales | 71 | 62 | 66 | 79 | 85 |
| Other Income | 0 | 1 | 0 | 0 | 0 |
| Expenses | 71 | 58 | 61 | 73 | 78 |
| Operating Profit | 0 | 5 | 5 | 6 | 7 |
| OPM% | 0 | 7 | 8 | 8 | 9 |
| Interest | 1 | 1 | 1 | 0 | 0 |
| Depreciation | 1 | 1 | 1 | 1 | 1 |
| Profit Before Tax | -2 | 2 | 3 | 5 | 6 |
| Tax% | -24 | 2 | -6 | 13 | 28 |
| Net Profit | -2 | 2 | 3 | 4 | 4 |
| PATM% | -4 | 3 | 5 | 5 | 5 |
Conclusion:
In conclusion, Kamdhenu Ventures demonstrates robust growth and financial health in FY24, highlighted by a significant revenue increase, positive EBITDA and PAT, and improved margins. The company’s strategy of achieving economies of scale and capitalizing on product premiumization has proven successful, positioning it well for continued prosperity in the future.


